Claudine Dashboard
Local control-plane web UI and background spawner daemon for the AirOps Research Agent System (19 agents). Two-process architecture that polls for queued tasks, spawns agent subprocesses with each agent's declared tool list, and streams output back to a shared store for live in-UI visibility.
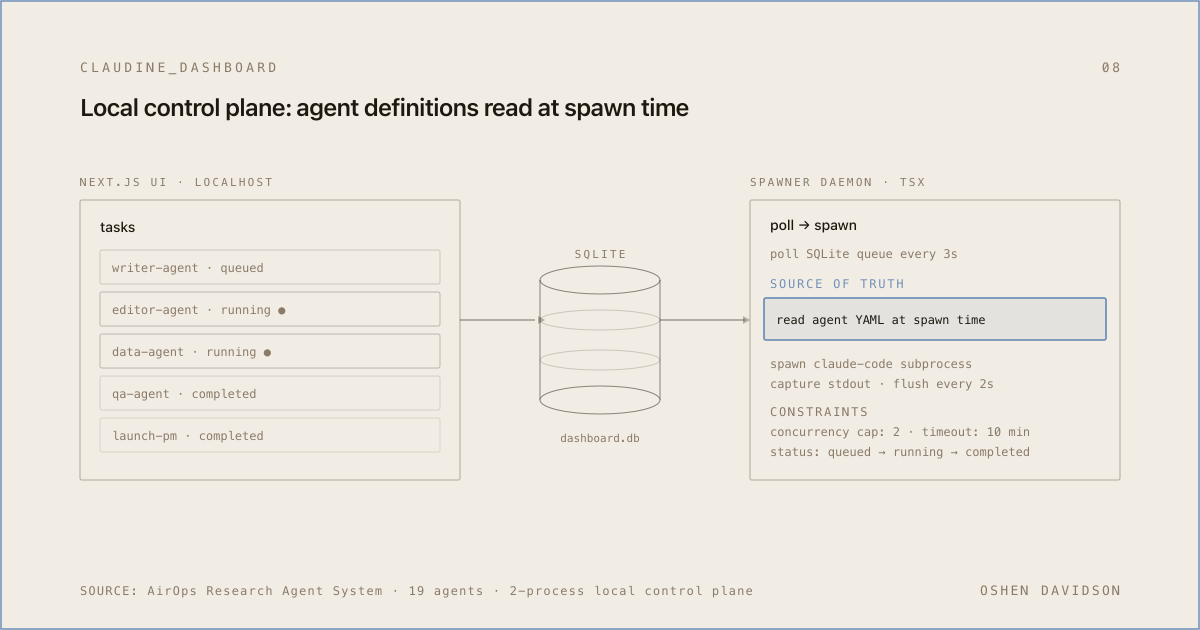
Claudine Dashboard is a local control-plane web UI and background spawner daemon for the 19-agent AirOps Research Agent System. It lets a user queue tasks against any agent, watch them execute live, and review captured output.
The gap it closes
Operating a 19-agent orchestration system from a terminal works at small scale but breaks down once tasks queue up, run in parallel, or take long enough that a human cannot stay in front of the prompt. There was no surface to see which agents had recent tasks, which were running now, what their output was, or which queued tasks had not been picked up yet. Spawning agents by hand also meant remembering each agent’s required tool list from its YAML frontmatter.
Architecture
Two-process design
The web UI serves the dashboard; a separate spawner daemon runs alongside it. The two processes coordinate through a shared local store. The UI writes new tasks into the store. The spawner polls the store every 3 seconds for queued tasks, spawns them, and writes updates back. The UI reads from the same store on every page load.
Source-of-truth decoupling
When a task is dequeued, the spawner reads the agent definition directly from the agent system repo and parses the YAML frontmatter to extract the declared tool list, then uses that to construct the agent subprocess invocation. The dashboard does not duplicate agent definitions; it consumes them from their source of truth. Adding a new agent to the orchestration system makes it available in the dashboard with no dashboard code change.
Subprocess management
Concurrency capped at 2 simultaneous tasks. Each task has a 10-minute hard timeout. Captured stdout is parsed line-by-line as a stream and flushed to the database every 2 seconds so partial output is visible while the agent is still running. Status state machine: queued to running to (completed | failed | cancelled).
Schema
Single tasks table holding id, agent_id, title, description, status (check-constrained to the five state values), captured output, timestamps (created, started, completed), and a viewed flag. Indexes on agent_id, status, and created_at keep dashboard query latency low as task history grows.
What shipped
Operational control plane for the 19-agent research orchestration system. Tasks persist across spawner restarts. Partial output for in-flight tasks is preserved on every 2-second flush. Agent definitions are read from the agent system repo at task-spawn time, so the dashboard never drifts from the agent system.